

Eliminating Blind Spots: The Case for Integrated Security and Observability

As organizations increasingly adopt security observability practices via SIEM, they fall into one of the obvious traps: over-reliance on a siloed signal, focusing only on logs, and not adding metrics as an additional source of truth. Each signal is important for understanding system behavior and its load, but they’re only half the picture if used in isolation. For example, a high CPU usage metric might look alarming, but without context from logs, it’s difficult to diagnose the issue causing such a load on the instance. When metrics and logs are managed separately, or by separate systems with non-mutual or non-correlated integration, or even in some cases not managed at all, it creates limited visibility. This makes it challenging to discover environmental and network issues, lack in data for RCA, and challenging incident resolution. The best solution to keep your environment secured and visible is by security-observability aggregation strategies.
The security world is witnessing a shift towards “full-blown” security-observability, where all the layers of the stack, from the application to the infrastructure, are monitored and analyzed in a combined-integrated fashion. This approach allows for better and in-depth comprehensive insights, while helping to eliminate blind spots that can occur when monitoring in progress. Investing in a platform that provides both observability and security will ensure that you stay ahead of the changes in the industry.
The AWS platform provides a masterclass in executing security-observability aggregation. AWS is the world’s most comprehensive and broadly adopted cloud with over 200 fully featured services from data center’s globally. AWS has a significant number of services and features – from infrastructure technologies like compute, storage, and databases – to emerging technologies, such as ML and AI, data lakes and analytics. This mixture of of infrastructure-as-a-service (IaaS), platform-as-a-service (PaaS) and packaged software-as-a-service (SaaS) solutions exist in the same ecosystem, making security engineer’s lives easier and providing more effective observability to cloud-based applications.
You’re probably familiar with Coralogix as the leading observability platform, but we combine both modern full-stack observability with a cutting-edge SIEM. Our SIEM platform helps centralize and analyze logs and metrics without reliance on indexing in real-time and monitors different data scales of our small project.
Let’s review two dependent pieces of information coming from different sources, and see how we can correlate them:
- AWS Performance Metrics: detailed monitoring of different resources, such as Amazon EC2 instances, Amazon EBS volumes, and Amazon RDS DB instances. AWS CloudWatch can import/export all the metrics from your account (both AWS resource metrics and application metrics that you provide).
- AWS CloudFront: CDN service, based network of edge locations seamlessly connected to different regions improving origin fetches and dynamic content acceleration.
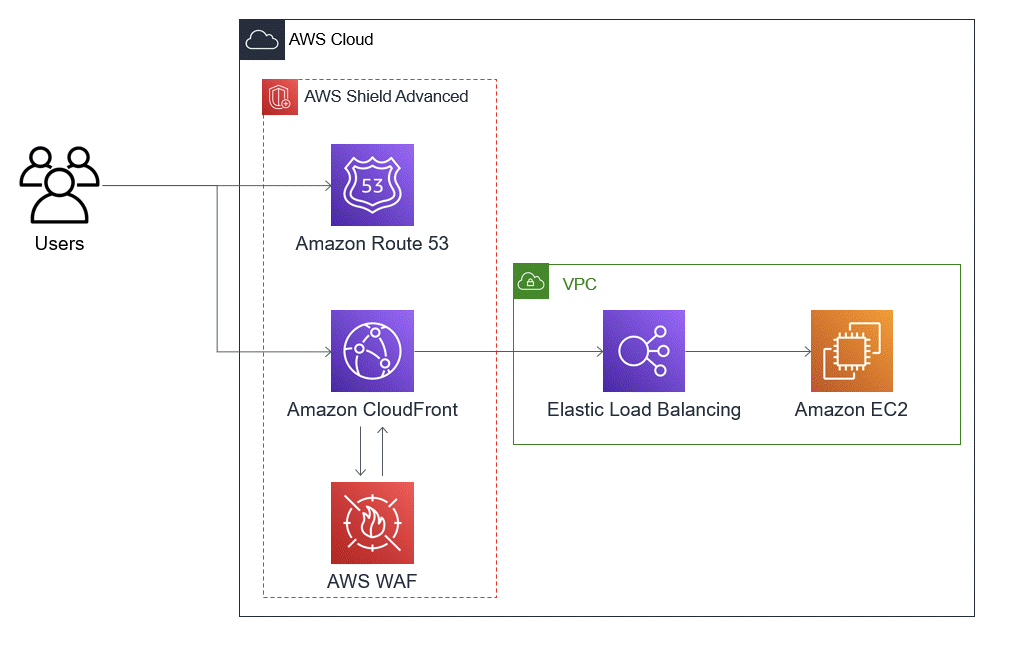
The configuration will include basic webapp Juiceshop. It has a variety of different static and dynamic content. We are not going to get into the bits and bytes of the specific of different environmental components, but for purpose of this project I have configured Cloudfront for the caching purposes and WAF to protect the public interface following the diagram below.
The following 3 components I used to ship logs to Coralogix:
- S3 to store Cloudfront logs with Coralogix Lambda Shipper to ship it directly to my Coralogix account
- Kinesys Firehose to stream WAF logs to Coralogix
- Cloudwatch Metrics to ship infrastructure stats of EC2 instance
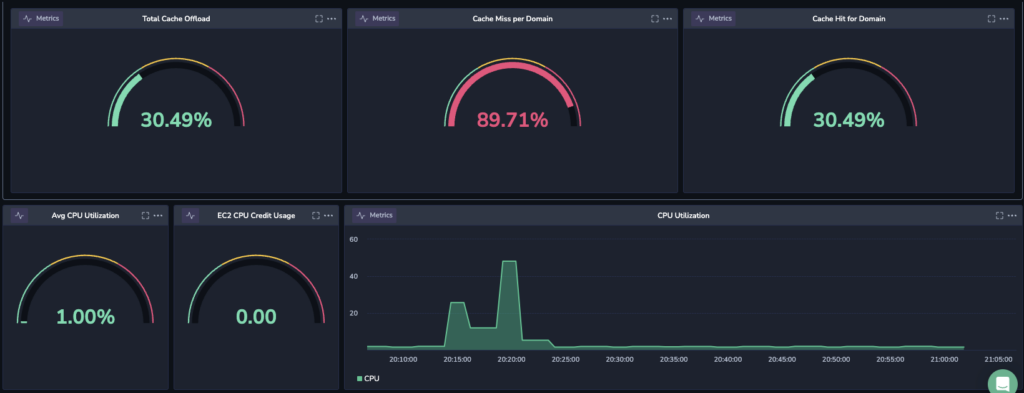
Once all configured, several minutes later I started see first bytes of information in my Coralogix account:


Next, we need to configure a Custom Dashboard to see an overview of the information. At the first I will configure different widgets to present the information from two different sources: Caching Stats and CPU Utilization.
Next, I aggregate those two under one widget and represent the data.
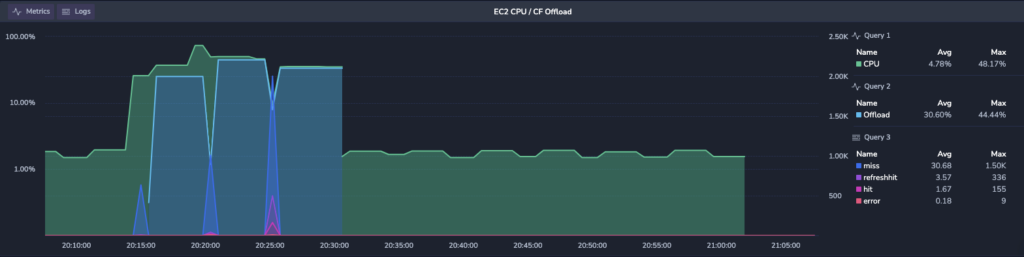
The beauty of this graph is the data correlation between the CPU and Caching offload:
Query 1 : CPU Utilization
Query 2 : Metric of caching ratio
Query 3 : Logs with different Edge response statuses
This data can point to specific issue or anomalies related to EC2, abnormal rates of offload, as well network related activity not correlated with CDN service.
The image above represents expected behaviour where CPU goes up while the caching started to accumulate. We can clearly see that Cloudfront edge starts to kick in and respond with the edge hits, meaning objects served from cache and not from the origin server. CPU utilization starting to go down, which makes absolute sense. So far this functionality is expected. The next event creates another wave of caching misses that ramps up CPU, which at the end stabilizes to some 3%-5% CPU utilization.
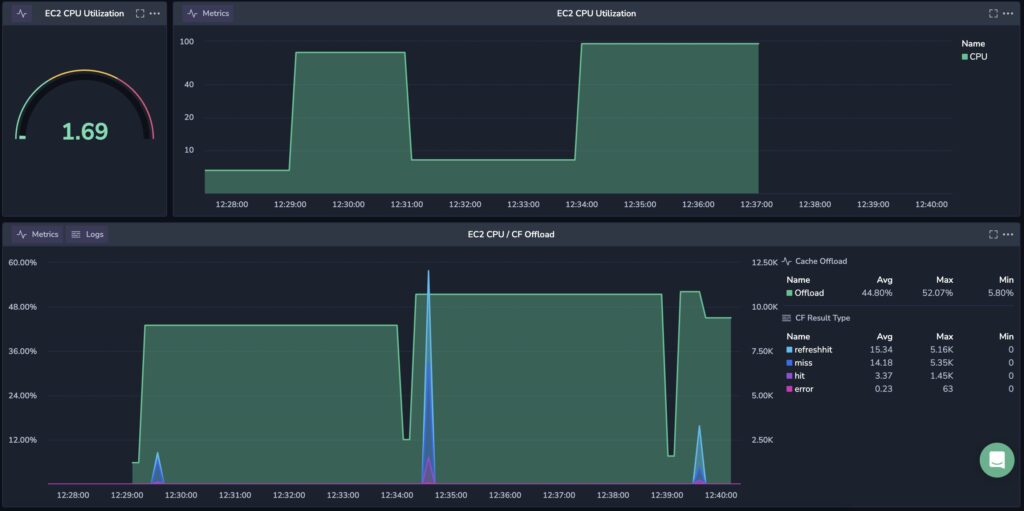
Here’s one last example in the dashboard below, which represents the anomaly we are looking for. Following CDN hits, there is a CPU anomaly which keeps the machine busy 50% average utilization, where we have edge hits and misses, but the CPU remains high all over the time.
This new approach to monitoring data is truly a game changer, revolutionizing how organizations safeguard their assets in a rapidly evolving environmental landscape. By leveraging advanced correlated analytics, real-time monitoring, and intelligent automation, this solution transforms traditional observability practices, enabling quicker detection and proactive responses to potential anomalies. This shift in technology not only enhances operational efficiency but also empowers organizations to stay one step ahead of potential failure, redefining the standards for robust and adaptive monitoring.
To learn more, talk to one of our security experts.
Book a demo
Complete this form to speak with one of our sales representatives.