
A critical vulnerability identified as CVE-2025-14847 (dubbed “MongoBleed“) affects MongoDB Server instances, exposing systems to unauthenticated information disclosure. This vulnerability allows a remote attacker to read sensitive data from the server’s memory without requiring authentication.
Severity: Critical | CVSS Score: 8.7 (v4.0) / 7.5 (v3.1)
Vulnerability Details
The vulnerability originates in message_compressor_zlib.cpp, where a logic error causes the decompression routine to return the allocated buffer size rather than the actual decompressed payload length. This discrepancy results in uninitialized heap memory being included in server responses.
Attack vectors include:
- Attacker transmits specially crafted compressed network packets to the target MongoDB server
- The decompression handler processes these malformed packets, triggering the length calculation error
- Uninitialized heap memory is exposed and returned to the attacker in the response
- Sensitive data residing in memory (credentials, database content, cryptographic material) may be disclosed
Resulting impacts:
- Exposure of sensitive data (PII, credentials, API keys)
- Bypass of authentication mechanisms via stolen tokens
- Reconnaissance for further attacks
Versions Affected
The following versions of MongoDB Server are vulnerable if network compression (zlib) is enabled:
| Product | Version | Affected Versions | Fixed In |
MongoDB Server | 8.2.x | 8.2.0 – 8.2.2 | 8.2.3 |
| 8.0.x | 8.0.0 – 8.0.16 | 8.0.17 | |
| 7.0.x | 7.0.0 – 7.0.26 | 7.0.28 | |
| 6.0.x | 6.0.0 – 6.0.26 | 6.0.27 | |
| 5.0.x | 5.0.0 – 5.0.31 | 5.0.32 | |
| 4.4.x | 4.4.0 – 4.4.29 | 4.4.30 |
Impact
Exploitation of this vulnerability could result in:
- Data Exfiltration: Attackers can continuously scrape server memory for sensitive business data.
- Credential Theft: Plaintext passwords or active session tokens residing in memory can be captured.
- Security Bypass: Information gathered can be used to bypass ASLR or other binary protections.
Recommendations for Mitigation
Immediate Actions
Upgrade: Update to one of the patched versions immediately:
- 8.2.3
- 8.0.17
- 7.0.28
- 6.0.27
- 5.0.32
- 4.4.30
Security Hardening
- Restrict Access: Ensure MongoDB ports (e.g., 27017) are NOT accessible from the public internet.
- Apply Network Policies: Use firewalls or Security Groups to whitelist traffic only from trusted application servers.
- Disable Legacy Opcodes: If possible, configure newer drivers to avoid using deprecated opcodes like OP_QUERY.
Long-term Measures
- Maintain updated software and subscribe to vendor security alerts.
- Implement strict network segmentation for database layers.
- Monitor database logs for anomalous query patterns.
Snowbit Response
- Scanned all SRC customer environments where MongoDB-related logs were available to identify vulnerable deployments, exposed services, suspicious access attempts, and potential exploitation activity aligned with MongoBleed.
- Based on the CVE-specific exploitation techniques and expected indicators, we have created custom hunting queries to detect which we have attached below
- We strongly recommend enabling MongoDB Audit Logs to improve detection capability and investigation depth.
References
- https://jira.mongodb.org/browse/SERVER-115508
- https://github.com/joe-desimone/mongobleed
Dataprime Hunting Queries
Detect Rapid, Pre-Authentication Connection Bursts from all IP
source logs
  | filter in($d.logRecord.attributes.message,
              'Connection not authenticating','Checking authorization failed')

      || in($d.cx_security.event_name,
              'Connection not authenticating','Checking authorization failed')
  | create $d.raw_remote from firstNonNull(
        $d.logRecord.attributes.client,
        $d.logRecord.attributes.remote,
        $d.attr.remote
    )
  | filter $d.raw_remote != null
  | create $d.client_ip from $d.raw_remote.splitParts(':', 1)
  | groupby $d.client_ip aggregate count() as $d.event_count
  | orderby $d.event_count:number desc
Detect Rapid, Pre-Authentication Connection Bursts from Public IP
  source logs
  | filter in($d.logRecord.attributes.message,
              'Connection not authenticating','Checking authorization failed')
       || in($d.cx_security.event_name,
              'Connection not authenticating','Checking authorization failed')

  // pull remote endpoint and extract the IP (strip :port if present)
  | create $d.raw_remote from firstNonNull(
        $d.logRecord.attributes.client,
        $d.logRecord.attributes.remote,
        $d.attr.remote
    )
  | filter $d.raw_remote != null
  | create $d.client_ip from $d.raw_remote.splitParts(':', 1)

  // second octet as string for 172.16–31 check (no regex needed)
  | create $d.o2 from $d.client_ip.splitParts('.', 2)

  // keep only public IPv4 (drop localhost, RFC1918, link-local)
  | filter $d.client_ip != null
       && $d.client_ip != '127.0.0.1'                   // localhost
       && !startsWith($d.client_ip, '10.')              // RFC1918
       && !startsWith($d.client_ip, '192.168.')         // RFC1918
       && !(startsWith($d.client_ip, '172.')            // RFC1918 (16–31)
            && in($d.o2, '16','17','18','19','20','21','22','23','24',
                         '25','26','27','28','29','30','31'))
       && !startsWith($d.client_ip, '169.254.')         // link-local

  | groupby $d.client_ip aggregate count() as $d.event_count
  | orderby $d.event_count:number desc
Sudden Spike in “Connection Closed” Event
source logs
| create $d.msg from firstNonNull($d.logRecord.attributes.message, '')
| create $d.ev  from firstNonNull($d.cx_security.event_name, '')
| filter $d.msg == 'Connection ended' || $d.ev == 'Connection ended'

| create $d.raw_remote from firstNonNull(
    $d.cx_security.source_ip,
    $d.logRecord.attributes.client_ip,
    $d.logRecord.attributes.client,
    $d.logRecord.attributes.remote,
    $d.attr.remote
)
| create $d.source_ip from if(contains($d.raw_remote, ':'), $d.raw_remote.splitParts(':', 1), $d.raw_remote)

/* exclude localhost and RFC1918 (10/8, 192.168/16, 172.16–31/12) */
| filter $d.source_ip != null
     && $d.source_ip != '127.0.0.1'
     && !startsWith($d.source_ip, '10.')
     && !startsWith($d.source_ip, '192.168.')
     && !(startsWith($d.source_ip, '172.')
          && in($d.source_ip.splitParts('.', 2),
                '16','17','18','19','20','21','22','23','24',
                '25','26','27','28','29','30','31'))

/* pull ISO timestamp safely via bracket access */
| create $d.tdate from $d['t']['$date']
| filter $d.tdate != null

/* minute grain without date funcs */
| create $d.hour_part   from $d.tdate.splitParts(':', 1)   // e.g., 2025-12-29T07
| create $d.minute_part from $d.tdate.splitParts(':', 2)   // e.g., 40
| create $d.minute_key  from concat($d.hour_part, ':', $d.minute_part)

| groupby $d.source_ip, $d.minute_key aggregate count() as $d.closes
| orderby $d.minute_key desc, $d.closes:number desc
Why Kubernetes Security and Monitoring Matter
Kubernetes has transformed how modern applications are deployed and scaled. Its flexibility and automation power innovation but also expand the attack surface. From control plane access to runtime drift, Kubernetes introduces layers of complexity that can obscure visibility if not properly monitored.
For security leaders, Kubernetes is both an opportunity and a risk. While it enables agility, it also decentralizes security responsibility across teams, tools, and cloud layers. Strong preventive controls like RBAC, Pod Security Standards, and NetworkPolicies reduce risk, but they’re only half the story. The real differentiator is continuous monitoring and observability: seeing what’s actually happening in real time.
In this blog, we’ll cover:
- The shared responsibility model between self-managed Kubernetes and managed Kubernetes services
- The key telemetry and log sources that drive visibility
- Real-world use cases and detection examples
- How to centralize observability for unified detection
Understanding Shared Responsibility
Just like database or cloud infrastructure monitoring, Kubernetes security begins with understanding who owns what. In a self-managed deployment, you’re responsible for the entire stack – from the control plane to worker nodes. In managed Kubernetes services (such as Amazon EKS, Azure AKS, or Google GKE), the cloud provider manages the control plane, but you remain accountable for workloads, nodes, networking, and observability.
| Layer | Self-Managed Kubernetes | Managed Kubernetes |
| Control Plane (API, etcd, scheduler) | You manage and secure | Cloud provider manages |
| Worker Nodes | You manage | You manage |
| Network & Access | You enforce policies and segmentation | You enforce policies and segmentation |
| Logging & Observability | You implement collectors | You enable and forward logs |
| Runtime & Workload Security | You protect workloads | You protect workloads |
Key takeaway: Cloud providers reduce operational overhead but do not eliminate your security responsibility. Visibility gaps often emerge when teams assume that managed services automatically log or secure everything – they don’t.
Securing Self-Managed Kubernetes
When you run your own Kubernetes clusters, you have full control – and full accountability. This freedom brings flexibility but also the burden of securing every layer of the stack.
Best Practices
- Control Plane Protection: Restrict API server access, enforce mTLS, and patch frequently.
- Secrets Management: Encrypt secrets in etcd and use Sealed Secrets or Vault for sensitive data.
- Network Security: Apply NetworkPolicies to limit pod-to-pod communication and use mTLS.
- Runtime Defense: Employ runtime anomaly detection to flag abnormal container behavior.
- Audit & Compliance: Centralize audit logs for investigations and regulatory proof.
- Disaster Recovery: Automate etcd and persistent volume backups.
Because all components are under your control, log collection must be deliberate. Aggregate logs from:
- API server
- Authentication service
- Controller manager
- Scheduler
- Audit pipeline
A centralized observability solution allows correlation across these layers – essential for detecting malicious API calls or policy drift before it becomes an incident.
Securing Managed Kubernetes
Managed Kubernetes services simplify cluster management by outsourcing the control plane, but your workloads remain your responsibility. Cloud providers secure the API server, etcd, and certificates – yet customers must secure workloads, IAM/identity roles, node configurations, and observability.
Best Practices
- Cluster Configuration: Enable audit logging, restrict public API access, and prefer private endpoints.
- Access Control: Use cloud provider identity integration (IAM Roles for Service Accounts, Workload Identity, or Azure AD Pod Identity) with least privilege.
- Networking: Deploy clusters in private networks and enforce segmentation using security groups/firewall rules and NetworkPolicies.
- Node & Pod Security: Avoid privileged containers and host-level access.
- Observability: Forward API server, audit, and authenticator logs to your observability or SIEM platform.
- Image & Registry Security: Use trusted registries, scan images continuously, and block unverified builds.
- Backups & Updates: Automate snapshots and stay on the latest Kubernetes versions.
- Compliance Integration: Leverage cloud-native security services (GuardDuty, Security Center, Security Command Center) and audit trails for unified visibility.
Critical Telemetry: What to Monitor
Borrowing from database monitoring principles, Kubernetes monitoring also depends on ingesting the right signals.
Below are the foundational log sources that together provide a full picture of your cluster’s health and security posture.
| Log Source | Purpose | Key Insight |
| Cloud Audit Logs | Records cloud platform API calls | Detect IAM misuse or privilege escalation |
| kube-apiserver | Captures all Kubernetes API requests | Identify unauthorized or high-risk actions |
| Authentication Logs | Track successful and failed access attempts | Spot brute-force or credential replay |
| Audit Logs | Chronicle cluster changes | Trace who modified what, when |
| Controller Manager | Manage state reconciliations | Detect unauthorized scaling or misconfigurations |
| Scheduler Logs | Show pod placement logic | Identify anomalies or resource drift |
Example Threat Scenarios
- Unauthorized API Access: Unexpected DELETE /pods by a non-admin user.
- Privilege Escalation: IAM role elevation followed by RBAC modification.
- Data Exfiltration: Repeated GET /secrets requests with abnormal egress traffic.
- Runtime Abuse: Container spawns interactive shells or connects to external IPs.
- Policy Drift: NetworkPolicy deleted or replaced unexpectedly.
These are the same detection concepts database security teams apply to DML anomalies or privilege grants – but in Kubernetes, they span multiple telemetry sources.
Correlating Data: Real-World Use Cases
Like database monitoring, value emerges when you correlate events across systems.
Use Case 1: Identity Role Change + Kubernetes RoleBinding
A DevOps user assumes a new cloud identity role (cloud audit log) and immediately modifies an RBAC RoleBinding (Kubernetes audit log). This combination often signals privilege escalation.
Use Case 2: Suspicious Pod Execution
A container starts executing binaries not typically present in the image (runtime log), while the scheduler places it on an unusual node. This can indicate lateral movement or a compromised workload.
Use Case 3: Config Drift + Unauthorized Access
The controller manager logs show a new Deployment, while the API server logs multiple failed authentications from the same IP. Together, this may indicate automated exploitation or misused credentials.
Centralizing Observability
Fragmented logs are the biggest obstacle to Kubernetes security. Control plane, identity, network, and runtime data often live in silos – making correlation difficult and delaying response.
Best Practices for Unified Visibility
- Ingest logs into a single platform – such as Coralogix.
- Correlate across layers: link Kubernetes audit data with cloud audit trails and runtime events.
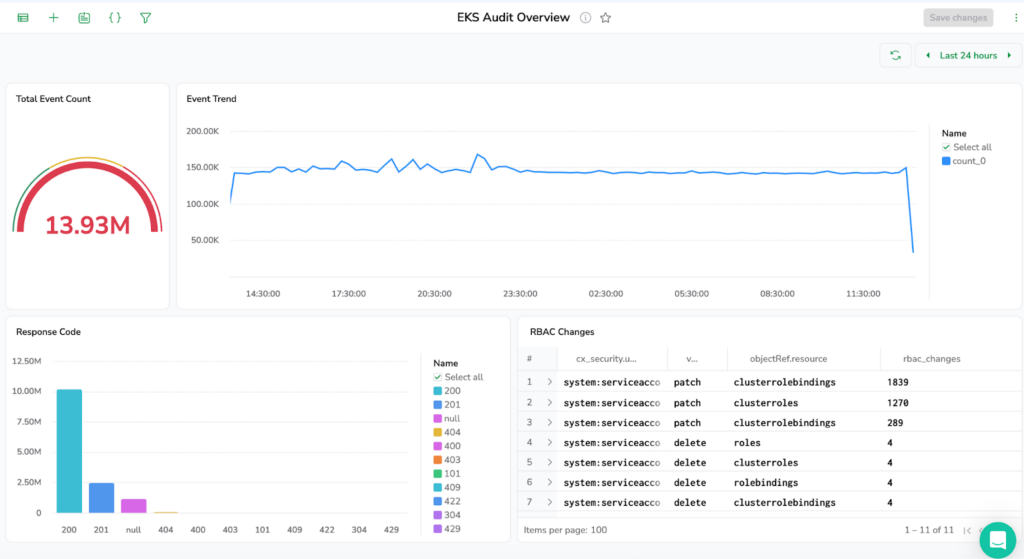
- Visualize risk: build dashboards for RBAC changes, failed authentications, and abnormal API calls.
- Suppress noise: use baselines to filter expected patterns, highlighting only deviations.
Executive value: Centralized observability enables governance – turning logs into measurable assurance for compliance, resilience, and audit readiness.
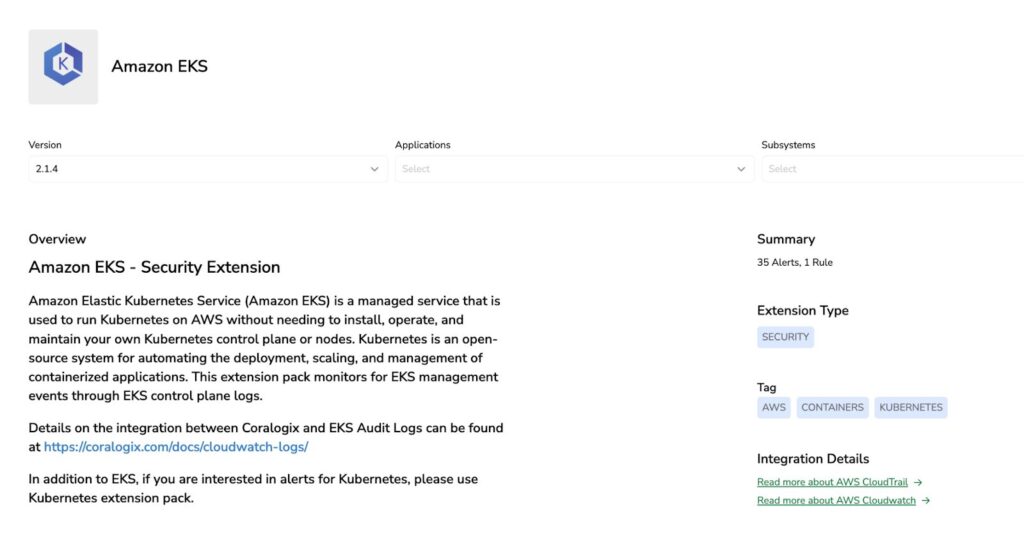
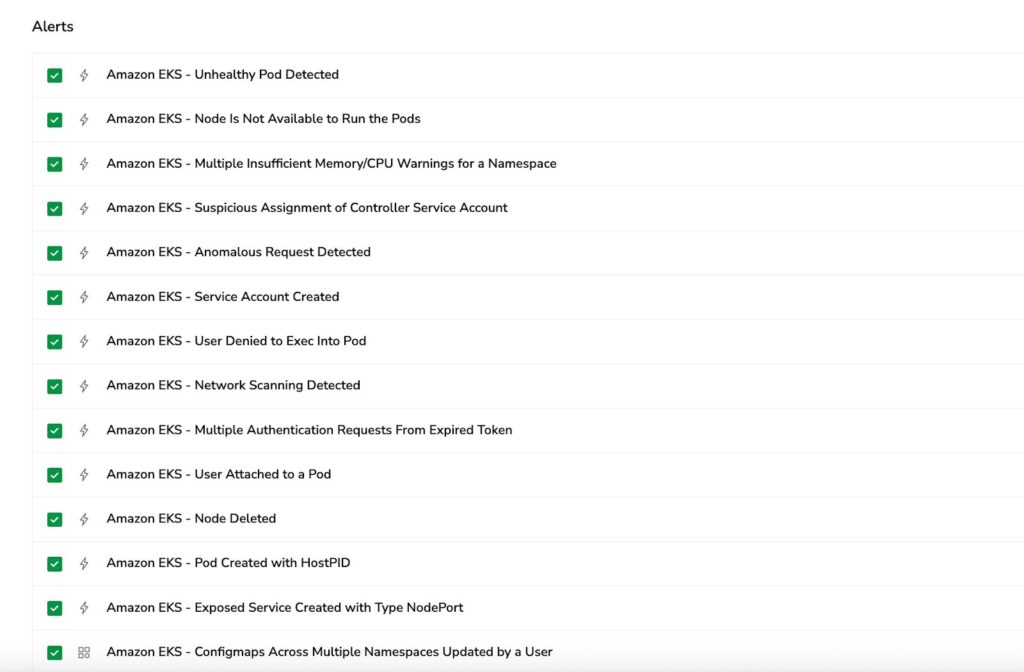
From Zero to Full Visibility: Coralogix Kubernetes Extension
The Coralogix Kubernetes extension delivers instant security monitoring with pre-built alerts for common threat scenarios and comprehensive dashboards that visualize your cluster’s security posture. No complex configuration required – start detecting anomalies and tracking compliance within minutes.
Conclusion
Kubernetes security isn’t just a technical checklist – it’s a visibility and governance challenge.
Self-managed clusters give full control but full accountability; managed Kubernetes services offload control plane operations but not responsibility. By aligning preventive controls, continuous monitoring, and centralized observability, organizations gain true operational resilience. For CISOs, that means shifting from reactive to proactive – transforming Kubernetes from a potential blind spot into a measurable pillar of enterprise security posture.
Learn more about how Coralogix powers observability for modern, secure Kubernetes environments across all major cloud platforms.
Mastering Web Application Security: Enterprise-Grade OWASP Detection Rules for AWS WAF, Akamai, F5 and CloudflareApplication Security, WAF, and OWASP form an interconnected defense strategy for web applications. OWASP (Open Web Application Security Project) provides the framework for identifying critical vulnerabilities through resources like the OWASP Top 10, while WAFs act as the protective layer that detects and blocks attacks targeting these vulnerabilities in real-time.
Web Application Firewalls (WAFs) are the first line of defense against sophisticated web-based attacks. By implementing comprehensive OWASP-based detection rules across your WAF infrastructure and sending logs to Coralogix, organizations can unlock deeper security insights through integrated log analytics, real-time alerting, and threat intelligence capabilities. Coralogix enables faster threat detection through advanced parsing and indexing, customizable dashboards, and automated alerts that provide security teams with early warning across critical web application attack vectors.
Understanding the Modern WAF Security Landscape
As web applications become increasingly complex and critical to business operations, they also become prime targets for attackers. The OWASP Core Rule Set provides a standardized framework for detecting and preventing common web application attacks. Whether you’re running AWS WAF, Akamai WAF, F5 WAF, or Cloudflare WAF, implementing consistent detection rules across your infrastructure is essential for comprehensive security coverage.
Modern WAFs generate vast amounts of security telemetry, capturing every request, response, and potential threat. However, raw WAF logs alone are insufficient. Organizations need sophisticated detection rules that can identify attack patterns, distinguish false positives from genuine threats, and provide actionable intelligence to security teams.
The detection rules outlined in this article focus on the most critical OWASP-based attack vectors:
- Cross-Site Scripting (XSS): Client-side code injection attempts
- SQL Injection: Database manipulation and unauthorized access
- Remote Code Execution (RCE): System-level command execution
- PHP Injection: Server-side code execution via PHP
- Server-Side Template Injection (SSTI): Template engine exploitation
- Server-Side Request Forgery (SSRF): Internal resource access via metadata services
Key Detection Rules for Enterprise WAF Deployments
Cross-Site Scripting (XSS) Payload Detection
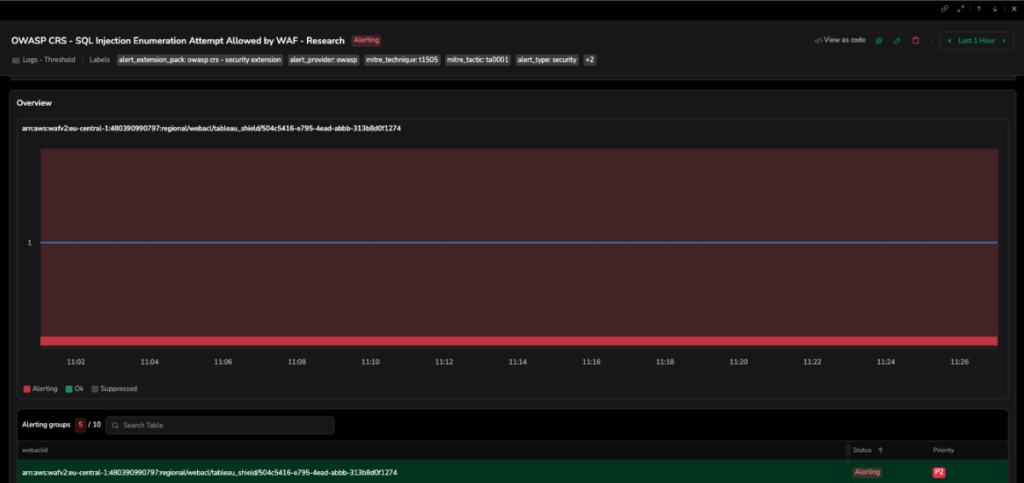
Overview
Cross-site scripting remains one of the most prevalent web application vulnerabilities. This detection rule identifies XSS attempts by searching for HTML/script markers and malicious payloads within query parameters and URIs. It focuses specifically on events that were allowed, accepted, or logged highlighting inputs that reached the application layer and represent potential successful injection attempts.
Detection Logic
The rule monitors for common XSS indicators including:
- HTML tags: <script>, <svg>, <iframe>, <object>
- Event handlers: onload=, onerror=, onclick=, onmouseover=
- JavaScript functions: alert(), prompt(), eval()
These patterns are examined in both URL-encoded and standard formats across query strings and URI paths.
Security Impact
Successful XSS exploitation enables attackers to:
- Execute arbitrary JavaScript in victim browsers
- Steal session cookies and authentication tokens
- Perform actions on behalf of authenticated users
- Deliver secondary payloads and drive-by compromises
- Escalate privileges within web applications
- Pivot to further attacks against users or services
Mitigation Strategy
Security teams should immediately block or rate-limit offending source IPs at the WAF or reverse proxy layer. Review application access logs and user sessions for signs of successful exploitation. For stored XSS, identify and remove malicious content from the database. Update WAF rules to block the specific payload patterns observed, and implement content security policies (CSP) to prevent script execution from unauthorized sources.
MITRE ATT&CK Mapping: TA0003 (Persistence), T1059 (Command and Scripting Interpreter)
SQL Injection Attack Detection
Overview
SQL injection attacks attempt to manipulate backend databases by injecting malicious SQL code into application inputs. This comprehensive detection rule identifies suspicious SQL keywords, function calls, and common payload patterns across multiple database engines including MySQL, PostgreSQL, MSSQL, and Oracle.
Detection Logic
The rule detects a wide range of SQLi techniques:
- Union-based injection: UNION SELECT statements for data exfiltration
- File operations: load_file(), into outfile, pg_read_file()
- System commands: xp_cmdshell, exec master
- Information gathering: Queries against information_schema
- Error-based extraction: updatexml(), extractvalue()
- Time-based blind SQLi: sleep(), benchmark() functions
- Obfuscation techniques: Hex encoding (0x), SQL comments (–, /*)
- Stacked queries: Multiple statements separated by semicolons
Security Impact
Successful SQL injection can result in catastrophic security breaches:
- Unauthorized access to sensitive data (credentials, PII, financial records)
- Data modification or deletion
- Authentication bypass and privilege escalation
- Remote code execution through database-specific commands
- Complete environment compromise enabling lateral movement
- Long-term persistence through backdoor accounts
Mitigation Strategy
Immediately investigate and block offending IP addresses at the WAF. Review correlated logs for signs of successful exploitation and contain any compromised systems. Long-term mitigation requires implementing parameterized queries and prepared statements throughout the application codebase. Enforce strict input validation on the server side, apply least-privilege principles to database service accounts, and conduct regular security audits and penetration testing to identify injection vectors before attackers do.
MITRE ATT&CK Mapping: TA0002 (Execution), T1059 (Command and Scripting Interpreter)
Remote Code Execution (RCE) Detection
Overview
This high-priority detection rule identifies requests containing patterns that suggest remote command execution or attempts to invoke system shells and processes. These patterns are commonly observed in web shell uploads, template exploitation (OGNL, Struts), and command injection attacks.
Detection Logic
The rule flags requests containing:
- Unix/Linux shells: /bin/sh, /bin/bash
- Windows shells: powershell.exe, cmd.exe
- Programming language execution: java.lang.Runtime.exec(), ProcessBuilder()
- System functions: Process.spawn(), system(), exec()
- Command execution indicators: Backticks, process invocation syntax
Security Impact
Successful RCE represents one of the most severe security breaches. Attackers who achieve code execution can:
- Run arbitrary commands on application servers
- Access, modify, or exfiltrate sensitive data
- Install persistent backdoors and malware
- Pivot laterally across the internal network
- Establish command-and-control channels
- Launch subsequent attacks against infrastructure
Mitigation Strategy
Configure the WAF to require high-confidence matches by combining multiple indicators rather than triggering on single patterns. Maintain aggressive patch management for web frameworks and dependencies many RCE exploits target known vulnerabilities. Enforce strong input validation and output encoding across all application layers. Run web services with least-privilege accounts that cannot execute system commands. Implement application-layer sandboxing where possible, and maintain robust logging to detect successful exploitation attempts.
MITRE ATT&CK Mapping: TA0002 (Execution), T1190 (Exploit Public-Facing Application)
PHP Code Injection Detection
Overview
PHP injection attacks attempt to execute malicious PHP code through vulnerable application endpoints. This detection rule identifies both server-side and client-side code execution attempts, including encoded payloads that bypass basic filtering.
Detection Logic
The rule searches for:
- Dangerous PHP functions: eval(), assert(), base64_decode(), system(), exec(), passthru(), popen(), proc_open()
- PHP tags: <?php, <?= (including URL-encoded variants %3C%3Fphp)
- HTML entity-encoded tags: <?
- Combined payload patterns: base64_decode() + eval() chains
Security Impact
PHP injection can lead to complete server compromise. Successful attacks enable:
- Remote code execution with web server privileges
- Web shell installation for persistent access
- Database credential theft from configuration files
- File system access and manipulation
- Privilege escalation through vulnerable SUID binaries
- Lateral movement within the hosting environment
Mitigation Strategy
Application hardening is critical: never use eval() or assert() with user-controlled data, validate and canonicalize all inputs, and apply context-appropriate output encoding. Configure PHP with disable_functions to prevent execution of dangerous functions. Enforce least privilege for web processes and isolate secrets using environment variables or secure vaults rather than configuration files. Tune WAF rules to block both raw and URL-encoded payloads while maintaining separate allow-lists for legitimate static assets and query patterns.
MITRE ATT&CK Mapping: TA0002 (Execution), T1059 (Command and Scripting Interpreter)
Server-Side Template Injection (SSTI) Detection
Overview
Server-side template injection exploits vulnerabilities in template engines such as Jinja2, Twig, Velocity, Handlebars, and EJS. Attackers inject malicious expressions that break out of the template context and execute arbitrary code on the server.
Detection Logic
The rule identifies common SSTI patterns:
- Expression syntax: ${} template variables
- Function invocation: (), .call() method access
- Object traversal: -> property access operators
- Prototype pollution: [prototype] access attempts
These patterns appear in query parameters or URIs when attackers attempt to manipulate template rendering.
Security Impact
SSTI allows attackers to escape the intended template scope and access the underlying execution environment. This leads to:
- Arbitrary code execution on the backend server
- Access to sensitive application variables and configuration
- Data leakage through template context exposure
- Privilege escalation through object manipulation
- Full remote code execution capabilities
- Compromise of confidentiality, integrity, and availability
Mitigation Strategy
Implement strict input validation before passing data to template engines. Use allow-lists for acceptable variables and avoid rendering untrusted input directly. Configure template engines in restricted or sandboxed mode when available. Implement proper separation between template code and user data. Consider using logic-less template engines that limit code execution capabilities. Regularly audit template usage across the application and conduct security reviews of template-rendering code paths.
MITRE ATT&CK Mapping: TA0002 (Execution), T1190 (Exploit Public-Facing Application)
SSRF Metadata Service Access Detection
Overview
Server-Side Request Forgery (SSRF) attacks exploit applications that fetch remote resources based on user input. This detection specifically targets attempts to access cloud metadata services a critical attack vector in cloud environments that can expose sensitive credentials and configuration.
Detection Logic
The rule monitors for requests targeting:
- AWS metadata service: 169.254.169.254, latest/meta-data
- GCP metadata service: metadata.google.internal
- Loopback addresses: \x7f, 0x7f, [::] (various encoding schemes)
Security Impact
Successful SSRF exploitation against metadata services represents a severe cloud security breach:
- Exposure of AWS IAM role credentials
- Theft of GCP service account tokens
- Access to Azure managed identity tokens
- Privilege escalation using legitimate cloud credentials
- Lateral movement across cloud resources
- Full account takeover in extreme cases
Mitigation Strategy
Implement defense-in-depth for SSRF prevention. At the cloud level, enforce IMDSv2 (AWS) or equivalent secure metadata service access that requires session tokens and blocks unauthenticated queries. At the application level, rigorously sanitize and validate all user-supplied input used in server-side requests. Maintain explicit deny-lists for internal IP ranges (169.254.0.0/16, 127.0.0.0/8, ::1/128) and known metadata service domains. Use network segmentation to prevent application servers from reaching metadata services. Implement egress filtering to restrict outbound connections from application servers.
MITRE ATT&CK Mapping: TA0001 (Initial Access), T1190 (Exploit Public-Facing Application)
Enhanced Visibility and Analytics with Coralogix
Deploying these detection rules across AWS WAF, Akamai WAF, F5 WAF, and Cloudflare WAF provides comprehensive coverage, but the true value emerges when WAF logs are centralized and analyzed through a platform like Coralogix. By streaming WAF logs to Coralogix, organizations gain:
Advanced Log Analytics
- Parsing and indexing that makes massive WAF log volumes searchable in seconds
- Pattern recognition across multiple WAF platforms for unified threat visibility
- Historical analysis to identify attack trends and campaign persistence
- Query optimization for complex threat hunting across distributed WAF infrastructure
Real-Time Threat Detection
- Anomaly detection algorithms that identify unusual attack patterns and novel payloads
- Automated alerting with customizable thresholds and severity levels
- Threat intelligence enrichment correlating detected attacks with known threat actors and campaigns
- Multi-stage attack correlation linking initial probes to subsequent exploitation attempts
Security Operations Efficiency
- Centralized dashboards displaying attack metrics across all WAF platforms
- Incident response acceleration through correlated log analysis
- False positive reduction using machine learning to tune detection accuracy
- Compliance reporting with audit trails and retention policies
- Total allowed/blocked requests across all WAF platforms
- Attack type distribution (XSS, SQLi, RCE, etc.)
- Geographic distribution of attack sources
- Top targeted endpoints and applications
- Time-series graphs showing attack volume trends
- Top offending source IPs with associated attack patterns
Implementation Best Practices
Multi-WAF Standardization
When deploying these detection rules across different WAF platforms, maintain consistent naming conventions, severity classifications, and alert configurations. This standardization enables security teams to develop unified playbooks and response procedures regardless of which WAF platform triggers the alert.
Tuning and Optimization
Initial deployment will generate false positives. Establish a tuning period where alerts are logged but not immediately blocked. Analyze patterns, identify legitimate traffic that triggers rules (such as security scanners, monitoring tools, or specific business workflows), and implement precise exclusions. The queries provided include common exclusion patterns for advertising trackers, transaction IDs, and authentication tokens expand these based on your environment.
Performance Considerations
Complex regex patterns in detection rules can impact WAF performance. Monitor rule evaluation latency and optimize patterns when necessary. Consider implementing sampling for high-volume endpoints while maintaining full coverage for critical authentication and data entry points.
Continuous Improvement
Threat landscapes evolve constantly. Schedule regular reviews of detection rules, incorporating new attack patterns, emerging vulnerabilities, and lessons learned from incidents. Subscribe to OWASP updates and security advisories relevant to your WAF platforms.
Optimization Based on Insights
By leveraging comprehensive WAF log analytics through Coralogix, security teams can:
- Identify attack campaigns by correlating patterns across multiple detection rules
- Prioritize remediation efforts based on the most frequently targeted applications
- Optimize WAF rules by analysing false positive rates and detection gaps
- Inform application security by sharing attack intelligence with development teams
- Demonstrate compliance with detailed audit trails and security metrics
- Predict future threats by analysing attack trend data and seasonal patterns
Conclusion
Web application security requires a multi-layered defence strategy, and WAFs serve as a critical control point for detecting and preventing attacks before they reach application logic. The six enterprise-grade OWASP detection rules outlined in this article provide comprehensive coverage against the most dangerous web application attack vectors: XSS, SQL injection, RCE, PHP injection, SSTI, and SSRF.
By implementing these rules consistently across AWS WAF, Akamai WAF, F5 WAF, and Cloudflare WAF, and centralizing log analysis through Coralogix, organizations achieve unified visibility, accelerated threat detection, and enhanced security operations efficiency. The combination of robust detection rules and advanced analytics capabilities empowers security teams to stay ahead of sophisticated attackers and protect critical web applications against evolving threats.
Remember that detection is only the first step effective web application security requires continuous monitoring, regular tuning, incident response readiness, and ongoing collaboration between security, development, and operations teams to address vulnerabilities at their source.
Threat Intel Update: November 2025What’s included:
- IOC visibility→ Overview of newly added IOCs that are automatically integrated into your protection layer
- Threat actor insights → Details on top APT groups, ransomware operators, and campaigns we’ve tracked this month
- Exploitation trends → Insights into the most exploited CVEs and active vulnerabilities observed globally
- Actionable intelligence → All IOCs are enriched with context — including threat actors, TTPs, and relevance scoring
What this means for you:
- Enhanced visibility → Get a clear understanding of trending threats, campaigns, and global exploit activity
- Continuous protection → Your environment benefits automatically from up-to-date threat intelligence without manual intervention
- Strategic awareness → Stay informed about global threat activity without operational overhead
- No additional action required → All newly added IOCs are already integrated into our detection and alerting mechanisms
Threat insights
Major cloud attack vectors
- AWS infrastructure targeting: Crimson Collective actively harvesting exposed AWS credentials, creating IAM users with AdministratorAccess, resetting RDS passwords, and snapshotting EBS volumes for data exfiltration
- Azure entra ID exploitation: Critical privilege escalation vulnerability (CVE-2025-59246) enabling unauthorized access to cloud identity infrastructure
- F5 BIG-IP nation-state breach: 266,000+ instances exposed online following long-term compromise of product development environments by Chinese APT ( UNC 5291 )
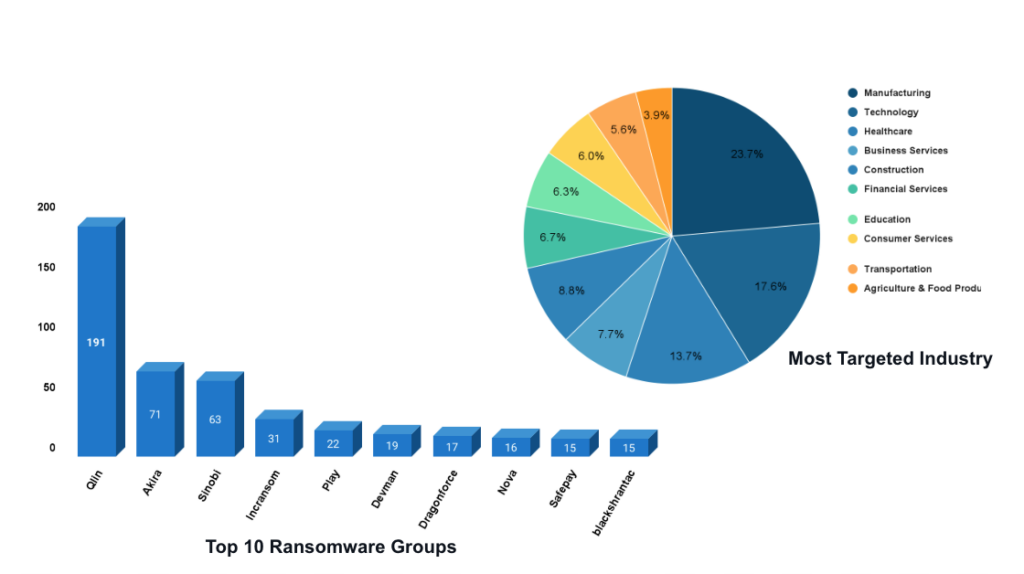
Ransomware activity
- Top groups: Qilin, Akira, and Snobi were the most active ransomware groups during this period
- Key exploits: CVE-2025-61882 (Oracle E-Business Suite) actively weaponized by Cl0p for initial access and data theft
- Evolution: Multi-platform capabilities with ESXi/vSphere targeting, enhanced anti-analysis, faster encryption algorithms
Critical CVEs
- Top actively exploited CVEs impacting cloud infrastructure, including Oracle EBS, Azure Entra ID, F5 BIG-IP, VMware Aria Operations
- Zero-days patched: 3 Windows zero-days in October Patch Tuesday (CVE-2025-59230, CVE-2025-24990, CVE-2025-47827)
- Cloud-critical vulnerabilities: ASP.NET Core Kestrel, Redis, Adobe Commerce (Magento), Linux sudo under active exploitation
Key trends in supply chain, cloud, & AI
Supply chain: Third-party integration compromise High-profile breaches at Qantas and MANGO demonstrated a shift to targeting third-party platforms integrated with core business systems like Salesforce. Attackers compromised marketing vendors and integrated apps to gain trusted access to customer data, bypassing traditional perimeter defenses.
Supply chain: “Living-off-the-Trusted-Stack” (LOTTS) Chinese-linked actors were observed weaponizing the legitimate, open-source Nezha monitoring tool. By abusing this trusted software, they successfully delivered the Gh0st RAT malware, inheriting privileged access and remaining undetected by traditional endpoint security solutions.
Cloud abuse: AWS-native attack playbook The Crimson Collective group executed a full-lifecycle attack on AWS environments. After compromising exposed IAM credentials, they escalated privileges to ‘AdministratorAccess’ and used the victim’s own AWS Simple Email Service (SES) to send extortion notes, guaranteeing deliverability and amplifying pressure.
AI abuse (offensive): AI-generated malware in the wild The state-aligned actor UTA0388 was confirmed to be using OpenAI’s ChatGPT as a force multiplier. The group used the public AI to develop a custom malware family (GOVERSHELL) and to craft highly convincing, context-aware phishing emails at scale.
AI abuse (internal): “Shadow AI” data exposure A global analysis revealed that 1 in 54 employee prompts into public GenAI tools contains high-risk sensitive data. This “Shadow AI” phenomenon has become a massive, unmonitored data loss vector, with 91% of organizations found to be regularly leaking proprietary information.
Most exploited- CVE
CVE-2025-61882 — Oracle E-Business Suite BI Publisher (10.0)
- Description: Unauthenticated remote code execution via the BI Publisher Integration component with a single low-complexity HTTP request, allowing data theft from internet-exposed EBS applications.
- EPSS: High Published: October 2025 CISA KEV Added: October 2025 Actively Exploited: Yes
CVE-2025-59287 — Microsoft Windows Server Update Service (9.8)
- Description: Remote code execution vulnerability via deserialization in Windows Server Update Service. Microsoft released out-of-band emergency update on October 23 to better address this critical flaw beyond the October Patch Tuesday fix.
- EPSS: High Published: 2025-10-08 CISA KEV Added: 2025-10-08 Actively Exploited: Likely
CVE-2025-10035 — Fortra GoAnywhere MFT (10.0)
- Description: Unauthorized third-party access to file transfer systems, primarily affecting systems with internet-exposed admin console. The flaw enables significant data theft and has been exploited since at least September 10, 2025.
- EPSS: 81.06% Published: September 2025 CISA KEV Added: September 2025 Actively Exploited: Yes
CVE-2025-49844 — Redis Lua Engine (Critical)
- Description: Use-after-free RCE in the default-enabled Lua engine affecting all Redis versions. Authenticated exploits enable sandbox escape and full host compromise (reverse shells, credential theft, lateral movement, malware).
- EPSS: High Published: October 2025 CISA KEV Added: October 2025 Actively Exploited: Yes (botnets and ransomware)
Indicators covered
Over the past month, we have expanded our threat intelligence coverage by integrating new Indicators of Compromise (IOCs) associated with the following ransomware groups,malwares and threat actors:
Ransomware & threat actor groups:
- Clop Ransomware
- Qilin Ransomware
- Conti Ransomware
- Anylock Ransomware
- Babuk Ransomware
- Yurei Ransomware
- Radar Ransomware
- Crimson Collective
- Lazarus Group
- Storm-2603
Malware & botnets
- Govershell
- Vampire Bot
- ClayRat
- Ghost Rat
- Amadey Stealer
- Lumma Stealer
- Redline Stealer
- RondoDox Botnet
- Clearfake
- ClickFix
- Amos Stealer
- XWorm RAT
- Katz Stealer
- Retro C2
And many more ….
Monthly IOC added
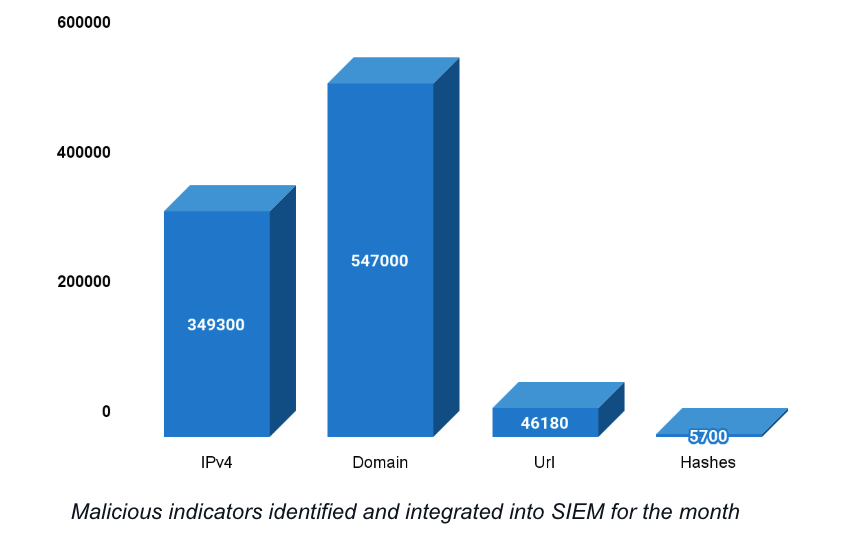
Ransomware activity
In today’s high-velocity digital ecosystem, visibility isn’t enough. SREs and engineering leaders need real-time insights, actionable signals, and automated workflows to operate at scale. As systems grow more distributed and cloud-native, the demand for intelligent observability and security has never been higher.
Extensions are solutions to get instant observability with prepackaged parsing rules, alerts, dashboards and more. At Coralogix, we don’t just offer extensions-we deliver operational value out of the box. Our curated ecosystem of extensions helps teams detect issues faster, understand them more deeply, and resolve them with confidence.

Observability that goes beyond the surface
Observability should empower, not overwhelm. While many platforms showcase a long list of extensions, Coralogix focuses on which use cases that really matters to SREs and administrators: depth, usability, and time to value.
With over 3,800+ deployable artifacts-including dashboards, alerts, and parsing rules-Coralogix helps SREs and platform teams achieve instant visibility into their environments.
| Platform | Actual Artifacts |
| AWS | 650 |
| Azure | 160 |
| Google Cloud Platform | 168 |
| AI Monitoring | 7 |
| Other Platforms | 2991 |
Instead of manually creating custom dashboards and creating alerts, teams can rely on real world,time tested tailored for common cloud services, infrastructure components, and application tiers to be efficient and quick in delivery of use cases.

Security that’s proactive, not reactive
Security isn’t just a function-it’s a shared responsibility. And SREs are increasingly on the front lines as there is good overlap in security situations leading to impact on application availability during security incidents.
Coralogix provides over 2,400 preconfigured security alerts to help you catch threats early-from IAM misconfigurations to anomalous login behavior. These aren’t generic templates-they’re curated rules built on best practices and real-world patterns.
| Category | Security Alerts |
| Core Security | 2443 |
| AI/Other | 1133 |
With full-stack visibility across logs, metrics, and traces, your team gets a unified view of reliability and risk-all in a single platform.

Content first approach
Coralogix takes a content-first approach: delivering enriched, deployable resources, not just raw connectors. This helps engineering and SRE teams spend less time configuring and more time optimizing.
The Coralogix advantage
- 3,800+ deployable assets for observability and security
- One-click extensions for AWS, Azure, GCP, Kubernetes, and more
- Out-of-the-box dashboards, alerts, and parsing rules
- Real-time streaming with no indexing delay or storage lock-in
- Proactive security content aligned with modern compliance needs
Whether you’re optimizing SLOs, tightening your security posture, or reducing mean time to resolution (MTTR), Coralogix delivers the tools and context your team needs-immediately.

See it for yourself
Curious what observability and security can look like when it’s built to scale with you? Visit the Coralogix Integrations Hub and explore our library of ready-to-deploy extensions.
Coralogix is excited to announce a major enhancement to our Unified Threat Intelligence (UTI) capabilities – now with expanded IOC matching beyond IPs. While our earlier focus was primarily on detecting malicious IP addresses, threats have evolved. Attackers now hide behind encrypted traffic, disposable domains, and polymorphic files.
To stay ahead, we’ve normalized new critical fields – JA3, JA4, domain, URL, and file hash and integrated them into our UTI engine. These are now fully supported in the Snowbit Utilities Extension, bringing faster detection, richer context, and broader coverage.
What’s New?
Until now, our IOC enrichment focused on:
- Malicious IP Address Detection
We’ve now added IOC enrichment support for:
- JA3 Fingerprint
- JA4 Fingerprint
- Malicious Domain
- Malicious URL
- Malicious File Hash
This extended support means more comprehensive detection, enabling threat hunters and analysts to surface stealthier adversarial activity across multiple attack surfaces.
Available Alerts
These enrichments power new dedicated alerts – now live via the Snowbit Utilities Extension:
- Unified Threat Intel – Malicious URL Detected
- Unified Threat Intel – Malicious JA4 Fingerprint Detected
- Unified Threat Intel – Malicious JA3 Fingerprint Detected
- Unified Threat Intel – Malicious Domain Detected
- Unified Threat Intel – Malicious Hash Detected
These alerts work alongside the existing IP-based detection to give you full-spectrum IOC monitoring.
Sample Log – Matched IOC (Domain)
Here’s how a matched malicious domain appears in logs under the cx_security namespace:

Each match is enriched with contextual intel such as feed source, confidence level, threat notes, and malware tags- enabling rapid triage and response.
Delivered Through Snowbit Utilities Extension
These detections and enrichments are available immediately for customers using the Snowbit Utilities Extension, offering:
- Plug-and-play integration
- Prebuilt alert rules
- Seamless enrichment at ingest
- Unified logging under cx_security
Whether you’re handling proxy logs, NetFlow, DNS queries, or file activity – these new IOCs are automatically correlated with threat feeds and surfaced in real time.
Why This Matters
Modern attacks rarely rely on static IPs alone. Adversaries:
- Use encrypted channels that evade DPI
- Register throwaway domains and malicious URLs
- Deploy hashed payloads and beaconing clients
With JA3/JA4 fingerprinting, file hash correlation, and domain/URL intelligence — you’re equipped to catch:
- TLS-based malware (e.g., Cobalt Strike, VenomRAT)
- Phishing infrastructure
- Malicious file downloads and lateral movement
Why VPC Flow Log Configuration Matters
In our investigative experience, we have observed that the default fields in VPC Flow Logs often provide limited visibility into network connections. This constraint hampers deep-dive investigations during incident response or threat hunting.
That’s why understanding and optimizing your VPC Flow Log configuration isn’t just a nice-to-have; it’s foundational to effective threat detection, troubleshooting, and cost control.
Therefore, we strongly recommend implementing proper logging configurations in VPC Flow Logs tailored to your environment and use cases.
In this document, we analyze the fields available in AWS VPC Flow Logs to evaluate their role in security, observability, and operational use. Each parameter was reviewed to understand what insight it provides, how it supports detection and troubleshooting, and whether it is essential in most environments.
By clearly identifying which fields deliver the most value, we help you build a smarter, more efficient logging strategy. We categorized fields as essential, recommended, or optional helping guide decisions on what to retain and what can be safely excluded to reduce logging volume and cost.
We previously published a blog covering common use cases of VPC Flow Logs and out-of-the-box detections available in Coralogix.
The blog can be accessed here .
Common Gaps in VPC Flow Log Configurations :
- Overlogging: Collecting all fields by default leads to high cost with limited added value.
- Missing NAT Context: Omitting pkt-srcaddr / pkt-dstaddr in NAT or EKS environments hides true endpoints.
- Dropped Visibility Fields: Fields like action, flow-direction, and traffic-path are often skipped, reducing clarity on traffic intent and exposure.
- Container Blindness: Important ECS-specific fields are left out, making it hard to trace service-level activity.
These gaps show why default setups are rarely enough. Tailored configurations are the most effective way to ensure both visibility and efficiency.
The Role of VPC Flow Log Fields
VPC Flow Logs offer dozens of fields that can be included in each log record, but not all are created equal. Some fields are crucial for identifying suspicious behavior, tracking traffic patterns, or troubleshooting issues, while others are more situational or redundant.
To help you strike the right balance between visibility and efficiency, we’ve grouped fields based on their value across security, observability, and cost.
High-Value Fields to Retain
These fields are considered essential for any VPC Flow Log configuration and should be consistently enabled. They provide visibility into network activity and are critical for security detection, forensics, and traffic analysis.
| Field | Description | Security Use Case |
| version | Log format version used | Cannot be disabled |
| account-id | AWS account owning the interface | Attribute traffic to specific accounts in multi-account environments; support tenant-aware detection. |
| interface-id | Network interface ID | Helps trace traffic to ENIs (e.g., NAT gateways, load balancers); useful in identifying misconfigured routes or abused endpoints. |
| instance-id | Linked instance ID | Drop if instance attribution isn’t needed |
| srcaddr | Source IP of traffic | Pinpoints traffic origin; enables geo-IP lookups, anomaly detection (e.g., access from unusual countries), and IP-based threat intel matching. |
| dstaddr | Destination IP of traffic | Identifies which systems or services were targeted; critical in tracking lateral movement or identifying protected asset exposure. |
| srcport | Source port used | Detects unusual port usage or port scans from external sources; highlights ephemeral port behaviors often seen in malware C2. |
| dstport | Destination port used | Identifies attempts to reach sensitive services (e.g., SSH, RDP, databases); supports port-based threat models. |
| protocol | Protocol number (e.g. TCP, UDP) | Flags suspicious or non-standard protocol usage (e.g., ICMP abuse, stealthy exfiltration via UDP). |
| region | AWS Region of resource | Drop in single-region setups |
| tcp-flags | TCP handshake/termination flags | Drop unless deep behavioral detection needed |
| pkt-srcaddr | Original (pre-NAT) source IP | Drop if not using NAT/EKS |
| pkt-dstaddr | Original (pre-NAT) destination IP | Same as above |
| action | ACCEPT or REJECT decision | Identifies blocked attacks vs. successful connections; useful for tuning firewall rules and alert triage. |
| flow-direction | Ingress or Egress indicator | Helps distinguish between inbound scans and outbound C2/beaconing; crucial for DLP and egress filtering. |
| traffic-path | Egress path from the VPC | Reveals whether traffic exited via internet, VPN, or peering; useful for identifying unapproved exposure routes. |
| ecs-cluster-arn | ARN of ECS cluster | Maps traffic to specific container clusters; supports container-aware security monitoring. |
| ecs-cluster-name | Name of ECS cluster | Human-readable cluster name for correlating flows in dashboards and alerts. |
| reject-reason | Why traffic was rejected (e.g. BPA) | Explains blocked attempts; particularly useful in enforcing AWS BPA (Block Public Access) policies. |
Lightweight Fields for Selective Use
These fields are not strictly required for baseline visibility and detection, and can be trimmed to reduce ingestion volume and cost. However, they offer additional insights for specific use cases such as network performance tuning, environment tagging, or deep forensic analysis. If you’re focused primarily on cost optimization, these are good candidates to drop – but each comes with a tradeoff depending on your monitoring goals.
| Field | Description | Tradeoff |
| packets | Packets transferred | Drop if performance tracking is unnecessary |
| start | Start time of the flow | Drop if timing isn’t critical |
| end | End time of the flow | Same as above |
| log-status | Log collection health indicator | Drop if not tracking ingestion gaps |
| vpc-id | ID of the associated VPC | Drop in single-VPC setups |
| subnet-id | ID of the associated subnet | Drop if not subnet-aware |
| type | Traffic type (IPv4/IPv6/EFA) | Drop if IP type can be inferred from addresses |
| az-id | Availability Zone ID | Drop if zone-level tracking not needed |
| sublocation-type | Edge location type (Outpost, etc) | Drop if not using wavelength/local zones |
| sublocation-id | ID of edge infrastructure zone | Same as above |
| pkt-src-aws-service | AWS service associated with source IP | Drop unless detailed AWS service tracking is needed |
| pkt-dst-aws-service | AWS service associated with destination IP | Same as above |
| ecs-container-instance-arn | ECS container instance (ARN) | Drop if Fargate-only or not using ECS |
| ecs-container-instance-id | ECS container instance ID | Same as above |
| ecs-container-id | Docker ID of first container | Drop unless deep ECS visibility needed |
| ecs-second-container-id | Docker ID of second container | Same as above |
| ecs-service-name | ECS service name | Drop if service-level mapping isn’t needed |
| ecs-task-definition-arn | ECS task definition ARN | Drop if not needed |
| ecs-task-arn | ARN of running ECS task | Drop unless container visibility required |
| ecs-task-id | ECS task ID | Drop in Fargate/basic ECS setups |
Customizing VPC Flow Log Record Format
There are two ways to define the log record format for AWS VPC Flow Logs:
- Default Format
This includes a fixed set of fields defined by AWS. It is easy to enable and provides baseline network visibility but offers no control over which fields are included. The version for default format is always set to 2. - Custom Format
This allows you to explicitly specify which fields to include in your flow logs. Custom format gives you fine-grained control over the log content, making it ideal for cost optimization, security-specific logging, or adapting logs to match your SIEM or analytics pipeline.
Step by Step Customization:
- Head over to the VPC Dashboard in the AWS Console.
- Select the VPC for which you want to enable flow logs.
- Click on the Flow Logs tab and choose Create flow log (or Edit if modifying an existing one).
- Configure all the required fields as per your requirement.


- Under Log record format, choose Custom from the dropdown.

- In the text box that appears, enter your desired field list (e.g., srcaddr dstaddr srcport dstport protocol bytes action).

- Click Create flow log to save and activate the configuration.
Conclusion
By customizing VPC Flow Logs, organizations can significantly improve network visibility, enhance security posture, and optimize logging costs. Moving beyond default configurations allows for precise control over data collection, ensuring that critical information for security detection, incident response, and operational analysis is retained, while extraneous data is excluded. This tailored approach is crucial for building a robust and efficient monitoring strategy within AWS environments.
Non-Human Identities (NHIs) refer to digital identities assigned to machines, applications, services, APIs, containers, bots, and other automated or programmatic entities within an IT or cloud environment.
Unlike user accounts that are tied to real people, NHIs enable systems to communicate and perform actions on each other’s behalf, such as a microservice querying a database or a CI/CD pipeline deploying code. These identities are typically associated with credentials like API keys, tokens, certificates, or SSH keys, which grant them access to systems resources and data.
NHI’s often hold elevated permissions and can access sensitive data or critical infrastructure components. If left unmanaged or unsecured, they increase the attack surface exponentially. Unlike human users, NHIs don’t often follow predictable work hours or behaviors, which makes them harder to baseline and analyze without proper controls.
Securing and monitoring NHIs ensures that only authorized systems can interact, access, or make changes within the environment — a crucial aspect of maintaining security, compliance, and system authenticity and integrity.
The number of NHIs has exploded with the rise of cloud-native architectures, DevOps automation, and AI workloads. In many organizations, NHIs outnumber human users tens or hundreds of times. Unfortunately, traditional identity and access management (IAM) systems were not designed to handle this scale or complexity. Meanwhile, attackers are increasingly targeting these identities because they are often poorly monitored, hard-coded into scripts, or left with excessive privileges which makes the urgency to act now driven by the increasing complexity of modern infrastructure and the growing volume of automated, machine-based communication.
Failure to secure and monitor NHIs can lead to a wide range of security incidents, including:
- Credential Leakage: Hard-coded credentials or exposed tokens in public repositories can be exploited by attackers.
- Lateral Movement: Once a malicious actor compromises one NHI, they can potentially pivot across systems using that identity’s access.
- Privilege Escalation: Overprivileged NHIs can be abused to execute unauthorized actions or gain access to sensitive systems.
- Data Exfiltration: Compromised NHIs can be used to silently extract large volumes of data without triggering traditional user-based alerts.
- Supply Chain Attacks: NHIs involved in a build pipeline process or software distribution can be hijacked to inject malicious code or backdoors.
NHI’s come in various forms, depending on the systems, environments, and tasks they are associated with. Common types include service accounts, which are used by applications or scripts to perform automated tasks; API keys and tokens, which grant access to cloud services or APIs; robots and bots, such as chatbots or automation bots used in IT workflows; IoT devices, which connect to networks and systems often with their own identity and authentication needs; and machine credentials, including SSH keys and certificates used for secure communication between servers or services. In cloud environments, NHIs also include IAM roles and managed identities, which allow cloud-native services like virtual machines or containers to interact securely with other components. As digital infrastructure evolves, the number and variety of NHIs continue to grow, making their visibility and management a top security priority.
Coralogix is getting ahead of the game by concentrating on NHI factors, such as :
- Inventory Management – Discover and inventories NHI’s with visibility into usage and access privileges.

- Context – context about each identity – ownership, usage, resource access, privileged status and stale accounts.

- Proactive Security – Continuously analyse and improve the security of non-human identities, trigger alerts and visualize activity through the custom dashboards.

- Integration – Integrating with Azure, GCP, AWS and Okta cloud
As the digital ecosystem continues to expand, the presence of non-human identities—ranging from bots and APIs to autonomous systems—has become foundational to modern infrastructure. Ensuring their security and effective monitoring is not optional; it’s critical. Without proper safeguards, these identities can be exploited, leading to breaches, service disruptions, and loss of trust. Just as human identity management evolved to meet growing digital demands, securing non-human identities must become a top priority to protect data integrity, ensure compliance, and enable seamless, secure automation across industries.
Best Practices for Monitoring Database ActivityHoney Tokens: Turning Attackers’ Curiosity into a Security Advantage Using CoralogixHoney Tokens are a security deception mechanism designed to detect unauthorized access or malicious activity by creating fake credentials, API keys, or cloud resources that should never be accessed under normal conditions. If an attacker interacts with a Honey Token, it triggers a pre-defined alert, helping security teams identify breaches early.
In a cloud environment, one should always assume compromise due to the cloud infrastructure’s complex and dynamic nature, where multiple risk factors contribute to potential security breaches.
The human factor plays a significant role, as misconfigurations—such as overly permissive IAM policies, exposed storage buckets, or unencrypted databases—are among the leading causes of cloud security incidents.
Supply chain risks, including compromised third-party dependencies and insecure CI/CD pipelines, further increase the attack surface.
Additionally, credential leakage, whether through exposed API keys in public repositories or phishing attacks against cloud administrators, can provide attackers with unauthorized access.
Given these risks, among other things, organizations must adopt continuous monitoring with automated threat detection to identify anomalies before they escalate. Assuming compromise ensures that security teams operate with a proactive mindset, focusing on rapid detection, containment, and response rather than relying solely on perimeter defenses.
Using Honey Tokens enhances security by detecting unauthorized access early and exposing attackers before they cause harm. These deceptive tokens act as tripwires, triggering alerts when accessed. Since legitimate users should never interact with them, any activity is a red flag, helping identify attack vectors like compromised credentials or insider threats. Unlike traditional security controls, Honey Tokens provide behavior-based detection, making them effective against zero-day exploits. Lightweight and cost-effective, they improve threat visibility and incident response when integrated with Coralogix.
Types of Honey Tokens
Honey tokens come in different forms, each designed to lure attackers and provide valuable insights into their activities. Organizations can enhance their security monitoring and threat detection across multiple attack vectors by deploying various types of honey tokens. Here are the most common types:
- Decoy Files – These files are labeled with sensitive names, such as “Financial Records” or “Employee Data,” to attract unauthorized access.
- Fake Credentials – These are non-functional login credentials planted in expected locations. Any attempt to use them signals potential credential theft and helps trace the attacker’s origin.
- Decoy Database Records – These false database entries resemble real sensitive data, allowing security teams to detect unauthorized access attempts and study attackers’ objectives.
- Canary Tokens – These are small triggers embedded in applications, servers, or URLs that notify security teams when accessed. They can be disguised as API keys, browser cookies, or unique URLs to track malicious activity.
- Email-Based Honey Tokens – These involve fake email addresses that, when targeted in phishing campaigns or hacker communications, provide insights into attackers’ tactics and sources.
By strategically placing honey tokens, organizations can improve their ability to detect and respond to security threats before real damage occurs.
Common Places AWS Access Keys Are Misplaced
AWS access keys are often misplaced in various locations, either by human error, insecure development practices, or overlooked configurations. A very common practice by attackers is to scan for exposed credentials in these areas, making them ideal places to plant honey tokens—decoy credentials designed to trigger alerts when used.
Here are some of the most common locations where AWS keys are inadvertently leaked, to name a few, and how you can leverage them for security monitoring.
- Code Repositories – The Goldmine for Attackers Developers frequently make the critical mistake of hardcoding AWS access keys during the development process into source code and pushing them to version control systems like GitHub, GitLab, Bitbucket, or AWS CodeCommit. Even private repositories are not immune—compromised developer accounts or accidental public exposure can leak credentials. Attackers routinely scan public repositories for credentials using tools like Gitrob and TruffleHog. To counter this risk, honey tokens can be embedded in configuration files (config.json, .env files) or within scripts. Any attempt to use these credentials can then serve as an immediate indicator of unauthorized access.
- Cloud Storage – The Hidden Credential Dump AWS S3 buckets, EFS, FSx, and even EBS snapshots are often used to store backup files, logs, or configuration data. Unfortunately, access keys sometimes end up in these storage solutions, either due to improper security controls or poor file organization. Attackers frequently probe for misconfigured S3 buckets and open shares, making them an excellent place for honey tokens. By placing decoy credentials inside a log file or old backup, you can detect unauthorized scanning and credential theft attempts in your cloud storage environment.
- CI/CD Pipelines & Automation Tools – A Growing Risk Continuous integration and deployment (CI/CD) pipelines automate software delivery but often involve credentials stored as environment variables or embedded in scripts. Jenkins, GitHub Actions, GitLab CI/CD, and Bitbucket Pipelines are notorious for accidental key exposure, especially when debug logs are left enabled. Infrastructure-as-code tools like Terraform, CloudFormation, and Ansible scripts can also be sources of credential leakage. Security teams can insert honey tokens into pipeline configurations or automation scripts to detect misuse and enhance visibility into unauthorized actions.
- Email & Collaboration Tools – The Unintentional Leak In fast-paced development teams, credentials often get shared over communication tools like Slack, Microsoft Teams, Google Drive file share, or even a simple email. Attackers gaining access to these platforms, either through phishing or compromised accounts, can search for AWS access keys (and not only) in old messages or shared documentation (e.g., Google Docs, Notion, Confluence). It is to note that in these sorts of platforms, access key leaks might be the least of the organization’s concerns. information such as the client’s records or other Personally identifiable information (PII) is most likely a critical asset to jeopardize. By strategically placing honey tokens in documentation or chat messages, security teams can track whether attackers attempt to use credentials from leaked conversations.
Coralogix In Action
By ingesting logs from both CloudTrail and Google Workspace, we can monitor all changes happening within both platforms and monitor the activity of both tokens in a single console.
We will now simulate two scenarios
- Leaked access keys found in a public GitHub repository
- Decoy sensitive file found in Google Drive
Planting the decoys
For AWS, we will first create the user and its access key with no permissions
to ease the process, we can use Terraform:
provider "aws" {
  region  = "eu-west-1"
}
resource "aws_iam_user" "this" {
  name = "foo"
}
resource "aws_iam_access_key" "this" {
  user  = aws_iam_user.this.name
}
locals {
  credentials = {
    access_key = aws_iam_access_key.this.id
    secret_key = aws_iam_access_key.this.secret
  }
}
resource "local_file" "this" {
  filename = "credentials.json"
  content  = jsonencode(local.credentials)
}
Note: In a real Honey Token used in a production environment, use a better name than “foo”. attackers might recognize this testing name and will refrain from using it.
After the running above Terraform, we get an additional file named credentials.json with a similar content to the following:
{
  "access_key": "AKIA3LVX...",
  "secret_key": "OjycnxVKdyRv..."
}
Now that we have the user with access keys ready, let’s plant them in a demo code:
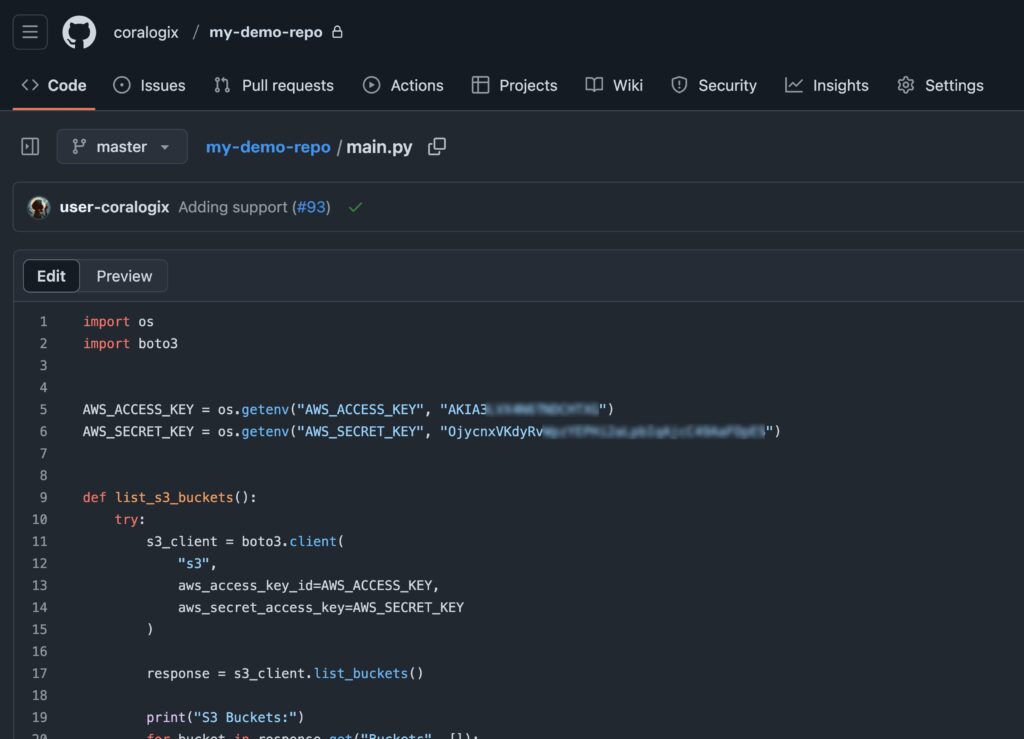
For Google Drive, we will create a file called user_data.xlsx which we will make public to anyone with this link in the main Drive directory. It’s important to note that for a real scenario it is recommended to place the file in a path that will appear real enough to arise the curiosity of the unwanted entity.
Setup the alerts in Coralogix
For AWS

With the query:
userIdentity.type:"IAMUser" AND userIdentity.accessKeyId:"AKIA3LVX..."
For Google Drive

With the query:
id.applicationName:"drive" AND event.parameters.doc_title:"user_data.xlsx"Investigating AWS Credentials
When the attacker finds the credentials and configures them in his AWS CLI, he will most likely try to first enumerate his permissions.
The first and most used API call is usually the get-caller-identity for the STS service to see the underlined user’s name. the response will look something like this
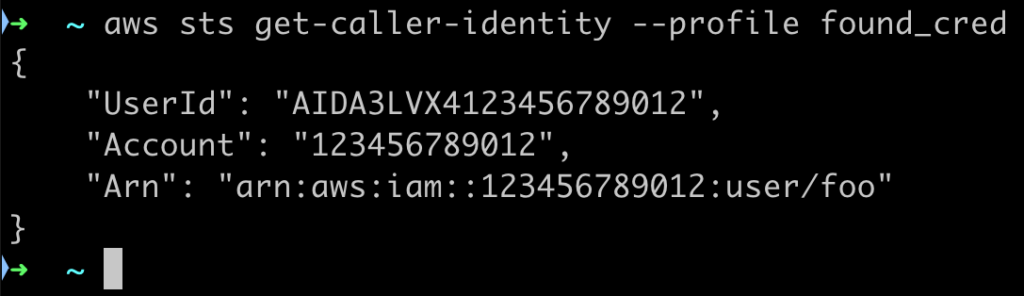
After knowing the user’s name, the attacker will try to understand what he can do in the environment
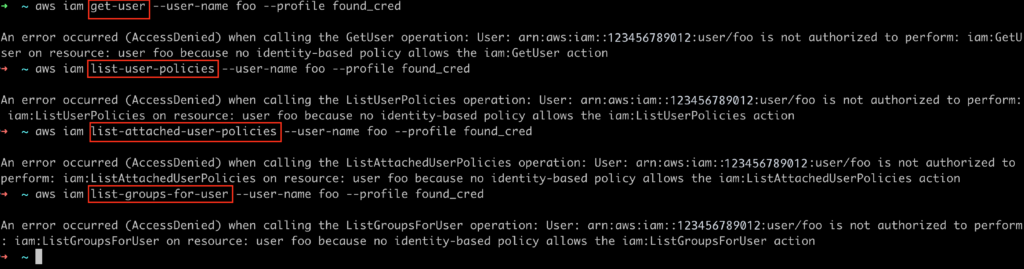
all those actions should be faced with AccessDenied response, as this user should not have any permissions attached
When an alert triggers, we can then investigate what the attacker tried to do. and of course to verify that he wasn’t able to perform any actions in the environment
we can use the query (the same as the alert)
userIdentity.type:"IAMUser" AND userIdentity.accessKeyId:"AKIA3LVX..."
and then do the “Show Graph For Key” action in the explore screen of Coralogix
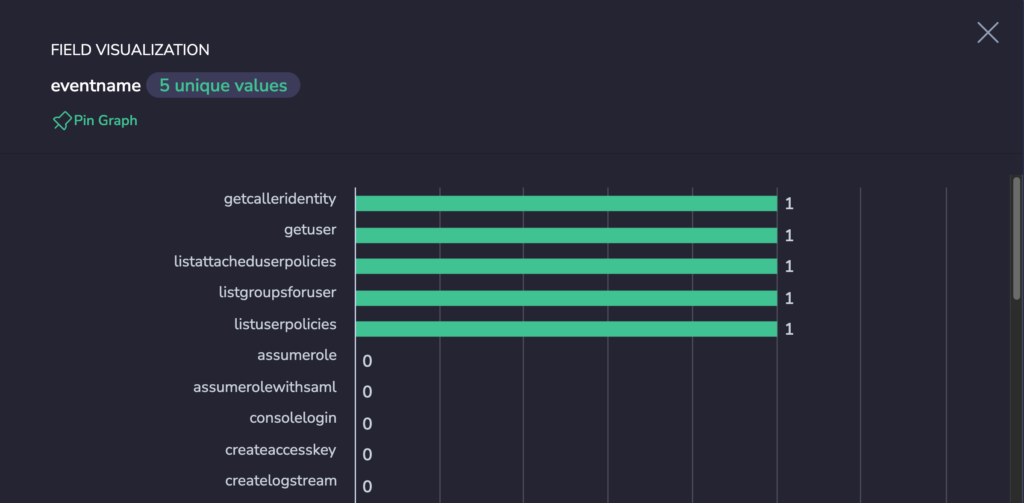
We can then verify that those action were not successful by enhancing the query
userIdentity.type:"IAMUser" AND userIdentity.accessKeyId:"AKIA3LVX..." AND NOT errorCode:"AccessDenied"
The only outcome should be the log for the get-caller-identity action that was initially performed.
In conclusion
Honey Tokens serve as an effective security deception mechanism, helping organizations detect unauthorized access and malicious activity by deploying fake credentials, API keys, decoy database records, and other lures that should never be accessed under normal conditions. Any interaction with these tokens should be monitored and have pre-defined alerts set up, allowing security teams to identify attackers early and analyze their tactics.
In cloud environments, security risks stem from misconfigurations, supply chain vulnerabilities, credential leaks, and zero-day exploits. Attackers frequently scan for exposed credentials in repositories, cloud storage, CI/CD pipelines, and collaboration tools, making these locations ideal for planting honey tokens. By strategically placing decoy AWS keys and monitoring unauthorized use, organizations can gain valuable intelligence on attack vectors, enhance threat visibility, and strengthen their incident response. Assuming compromise as a security mindset ensures that teams focus on proactive threat detection and rapid mitigation rather than relying solely on perimeter defenses.